Visualizing how fractions are written as decimal digits
Posted by jimblackler on Jul 5, 2015
For a demo click here
I’ve written a web app that generates diagrams showing the sequence of digits when a fraction (such as ¼) is written in decimal form (0.25). One diagram can be used for every fraction (non-negative proper fraction) with a particular value on the bottom (the denominator). My program feeds data into the springy.js framework which uses a force-based layout to draws network diagrams of graphs.
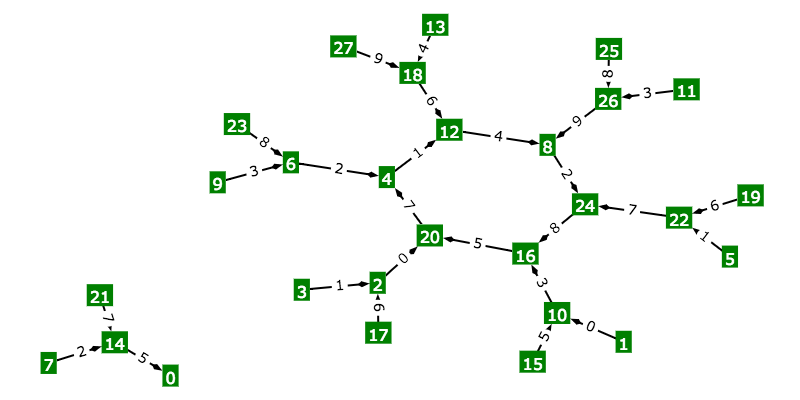
To see how to find the decimal form of 21 / 56, click on the demo link. This diagram can be used to find the decimal form any non-negative proper fraction with 56 on the bottom.
Start by writing down “0.” (since all simple fractions are no less than zero but under one). Then find the vertex labeled ‘21’, your numerator (the top part of the fraction). Next simply follow the arrows, writing down the numbers on the arrows as you go. The arrow labeled “3” takes you to vertex 42 (write down “3”), “7” to vertex 28 (write down “7”), and “5” to vertex 0 (write down “5”). We always stop at ‘0’ so the sequence is complete.
You’ve written “0.”, “3”, “7”, “5”. A quick check on a calculator will confirm that 21 / 56 is equal to 0.375.

This diagram works for all other fractions with a denominator of 56 and numerator between zero and 55. On the same diagram try for ‘18’. The sequence starts out “3”, “2” but after a bit you’ll find you’re in a cycle that starts “1”, “4”, “2”, “8”, “5”, “7”, then returns to “1”.
Checking with a calculator shows me that 18 / 56 is 0.32142857142857142857… repeating forever.
Motivation
I made the app because I was wondering if there was a rule to say which fractions had repeating sequences when written as decimals, and it occurred to me how easy it would be to generate a graph from the data using a standard tool. I’m still thinking about the rule problem, but the diagrams help visualize the problem.
More diagrams
Here are some more examples for fractions of different denominator values.
Note that you can change the values in the input boxes then hit return. You can also use the up/down arrow boxes when an input box is enabled.
Springy is like most popular graph diagram generators in that it uses a spring system to arrange the vertices.
This makes it interesting and fun to.manipulate. However you usually need to ‘unknot’ diagrams by hand to remove any overlapping edges. A graph drawing algorithm could be tailored to generate these diagrams while maintaining more of the symmetry and making overlapping edges impossible.
How it works
Pseudocode to generate the diagram:
for (numerator = 0; numerator != denominator; n++) {
  // make a vertex labeled ‘numerator’
}

for (numerator = 0; numerator != denominator; n++) {
  digit = (numerator * 10) / denominator;
  next = (numerator * 10) % denominator;
  // make an edge from ‘numerator’ vertex to ‘next’
  // vertex, labeled ‘digit’
}
To understand how this works, consider how you might find just the first digit after the decimal point in an expansion of a fraction n / d (non-negative proper fraction). Remember that in general, multiplying a number by 10 shifts its decimal point one position to the right. If we do that to any fraction we get 10n / d. Now what was the first digit of its decimal form (right of the decimal point) is now to the left of the decimal point. So the whole part (the ‘quotient’) of 10n divided by d will give us the first decimal digit. The remainder of 10n divided by d (still over d) represents the part to the right of the decimal point, which is the rest of the decimal string (discarding the leading ‘0.’). Since ‘n’ hasn’t changed we can find this value on the same diagram, and repeat the process to get the next digit, then continue forever to get the whole string!
Let’s look at an example 25/27. Your calculator will show you this is 0.9259259259259259. But let’s verify with this method.
25 multiplied by 10 is 250, which divided by 27 is equal to 9 + 7 / 27. “9” is the whole part (the quotient) and this is the first digit. 7 / 27 is the remainder which is the rest of the string. Indeed, my calculator tells me this is 0.25925925925925924. If I repeat the process for 7 / 27, I get 70 / 27 which is 2 + 16 / 27. “2” is the next digit. Repeat with the remainder, so 16 / 27 goes to 160 / 27 which is 5 + 25 / 27. The next digit is “5”, but now our remainder is what we started with. So we will repeat “9”, “2”, “5”, forever, verifying the calculator result of 0.925925925….
Different bases
What if we wanted to see how fractions would be written in systems other than decimal, such as binary or hexadecimal? Changing the base is as easy as changing the number 10 in our calculations above. This diagram shows part of a binary base expansion.

Some more examples:
Patterns
We get lots of interesting patterns from playing with the numbers, but whatever you do, certain constraints arise. Many of thse are from the fact that the kind of graph we create is a directed pseudoforest, that is, every vertex has exactly one edge out (although this may be to itself).
Given the ‘many to one’ relationship between the different vertices (each vertex has just one edge out) you can only ever end up with one or more subgraphs of connected vertices formed of a ‘hub’ (one or more vertices in a cycle) and ‘spokes’ (non cycling or tree graphs heading into the hub).
The rough explanation is that a walk starting at any vertex you will always end in a cycle or (closed walk) since even ‘0’ has an edge back to itself. Any other vertex with a walk reaches any vertex on this cycle will be part of the same subgraph (connectable in any direction on the edges). Since any walk can only have one cycle, no other cycles can exist in this subtree. So, all walks entering the cycle can be drawn as trees rooted at the position they enter the cycle.
But beyond that in this specific case (the fraction graphs) you see some really interesting patterns just by changing the numbers.
Note how values of ‘d’ that have no factors in common with the base (in the case of 10 can’t be evenly divided by 2, 5 or 10) have subgraphs that are all cycles.
You might consider how d’s prime factors (including if they are in common with the base’s prime factors or not) affect the shape of the graph. You might ask what determines the number of subgraphs, or the number of vertices in the cycles, and whether they are all the same.
Another interesting thing about this is the whole graph is a closed walk (starting at any value will end up in the original position) you now have a graph equivalent to the kind encountered in the modular arithmetic used in cryptography.
Source
I hope you enjoy the app. The source can be found on GitHub.