A tree diagram (SVG) generation tool in JavaScript
Posted by jimblackler on Oct 16, 2014
This tool creates SVG (Standard Vector Graphics) files to illustrate information structured as a basic tree.
Here I define tree as an ordered graph without loops where every node has zero or one ‘parent’ nodes in the same tree.
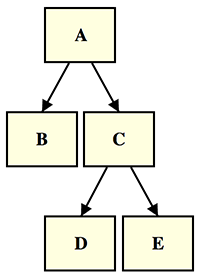
It’s a very common structure in computing and will be familiar to most as the structure of folders on a personal computer (as seen in the ‘Unix’ example). It’s also the structure of classes in a single-inheritance object oriented programming language (as seen in the ‘Java’ example).
However lots of real world data can be formatted this way too. For instance an ‘org chart’ of the hierarchy of an organization (because everyone has a boss, apart from the boss of the company).
Project
I wanted to visualize binary search trees to help understand a problem, but I couldn’t find a simple tool to take tree data as text and to output it as a line drawing. I also became interested in the problem of arranging arbitrary tree arrangements neatly, in the original breadthwise order, without overlapping and with sensible spacing between elements. So, I decided to make a tree diagram tool myself.
It may be useful as a tool to generate diagrams of tree structures for documents, presentations and so forth, so I’ve put it online.
The tool is written in pure JavaScript and creates SVGs that all modern browsers can render. This means the scripts can also be dropped directly into web applications that create tree data on the fly, as a reporting/visualization tool. The source is freely licensed under GPL and placed on GitHub.
Use
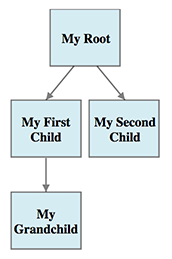
To make your own diagrams all you have to do is visit one of the demo pages and edit the data (specified in classic tabular style, e.g:
My Root
  My First Child
    My Grandchild
  My Second Child
This will generate the diagram below:
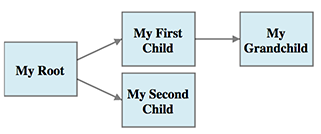
You can edit the options (provided as editable JSON in an edit box on the page) to customize the image in various ways. For instance setting "flipXY": 1 will convert the image to a horizontal diagram.
I won’t detail all the options here because it’s designed for experimentation; just play with the values and see what you get. You can change the relative size and margins of the nodes, line spacing in the labels, arrow size and direction and more.
To change the colors or line styles of the nodes and arrows, or the label font size and style, simply edit the CSS data on the page. For instance, editing the CSS as follows…
text {
  text-anchor: middle;
  font-size: x-small;
  fill: white;
  }

rect {
  fill: green;
  stroke: black;
  stroke-width: 0;
  }
.. would result in this diagram: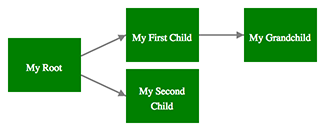
Method
The diagram generator has the task of building diagrams that have elements positioned and spaced sensibly, without nodes or lines overlapping, and making the best use of available space (the nominated rectangle the diagram may occupy). Element positions need to be considered as a whole, as repositioning any element will have a knock-on effect on any other elements it might now overlap, free space to better position, and so on.
After experimentation I developed a relatively simple method with all nodes having their vertical position fixed in a level based on the distance to their tree root. The horizontal positions are in order of the breath order of the nodes in the tree, but other than that, they are allowed to move horizontally. The method relies on identifying the one level which has least potential to be repositioned, laying this out with regular spacing and fitting the other rows around it.
Relative values are given in the options for the widths of nodes and the spaces between sibling nodes (nodes that share the same parent) and cousin nodes (nodes that are the same distance from their roots but don’t share the same parent).
-
The tree structure is converted into an array of levels to be displayed in rows.
-
Each level is measured for its minimum width given the spacing ratios in the
options. -
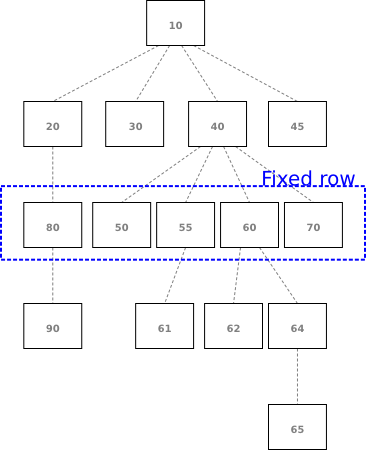
The row that occupies the most screen width is nominated as the fixed row.
-
All rows between the fixed row up to an including the root are now considered in turn. For nodes that have children (in the level below) they are given an ideal horizontal position as the average (horizontally) of their children.
-
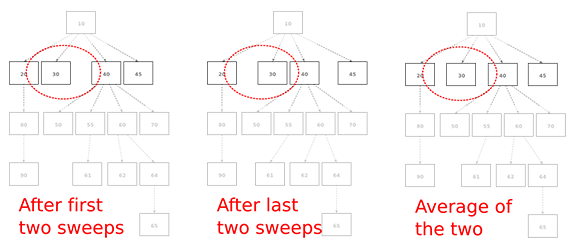
A ‘sweep’ process then travels left to right across the nodes and forcing the rightmost node of each considered pair further right to ensure that it is not positioned too closely to its predecessor. As this may push nodes outside the diagram area, a return sweep performs the same operation from right to left with the rightmost element constrained to the available horizontal space.
-
These positions won’t result in overlapping elements. However because of the way the sweep operates, elements will often result in nodes positioned immediately to the right of neighbours when there is a large gap remaining that could be occupied. In order to have nodes occupy the central position in the available space, a third and fourth sweep are performed in mirror-image of the first two (right to left then left to right). Naturally after sweep four the elements are often positioned immediately to the left of neighbours. So, the positions after sweep two and sweep four are averaged to determine the final position of the nodes; non- overlapping and evenly positioned in the available space.
- A similar operation is performed on all the rows below the fixed row traveling downwards. On this occasion, the ideal horizontal position for the nodes is an even distribution of children underneath, with the group centered on their parent node.
Contact
I hope some find the tool useful or interesting. Check out the site and as ever, feel free to contact me on the comments or at jimblackler@gmail.com, or make requests via the GitHub page.
Hi Jim,
Thank you so much for this really neat tool! Good effort! I also really like the fact that you can customize things in it on the fly, like box width and height. Really cool.
I think there might be an error in your explanation when you are talking about tabular style usage in the “Use” section. You have the following:
”
My Root
My First Child
My Grandchild
My Second Child
”
But I think it should be:
”
My Root
My First Child
My Grandchild
My Second Child
”
to make the image below the code. That is, the grandchild is missing a level of indentation.
Thanks for making this open source and available online.
Regards,
Kolos
hmm, all the white space was removed from my comment so it does not really show what I wanted… Here is a workaround:
Example with error:
My Root
*My First Child
*My Grandchild
*My Second Child
Solution:
My Root
*My First Child
**My Grandchild
*My Second Child
You are absolutely correct Kolos! Not sure how that happened. Updated the article.
Thank you so much for this! It’s a really great tool.
Hi Jim,
Great tool you’ve put together! I was using it to help one of our AI guys put together a tree structure of our financial data fields to train his ML system to make some neural network of our research. Now I’m using it to demonstrate the tree structure of our website navigation menu and was wondering if you knew of any tools that could make a quick mockup of a navigation menu based on the same hierarchy data (one where the secondary menu changes depending on the current primary menu item selected). Essentially, I’m looking for a tool that allow me to rejig the hierarchy on the fly and demonstrate the changes immediately in a presentation.
Thanks,
Ian
Hi Ian. Many thanks for your note. The tool could definitely be adapted to allow dynamic changes, because (1) it’s a script so could be embedded on a web page and have an interface exposed that could be called to make updates and (2) SVG allows animation transitions. Someone would have to adapt it obviously but it could be done.